Brain Ui
The Brain UI is a dedicated window for browsing, reading, and navigating your Second Brain knowledge. Think of it as your project's Wikipedia — but written by your AI agents, organized automatically, and rendered beautifully with dark theme support.
Opening the Brain Window
Click the Brain icon in Quack's main interface to open the Brain window. It opens as a separate, resizable window that you can keep alongside your code editor.
The Four Views
The Brain UI is organized into four main sections, accessible from the left sidebar:
1. Knowledge (Sidebar)
The knowledge sidebar shows all your Brain entries organized by type. Each entry appears with:
- Type icon: Color-coded by category (red for bugs, blue for decisions, orange for gotchas, cyan for patterns)
- Audience badge: Green for "Human" content (guides), purple for "AI" content (structured entries)
- File name: The descriptive kebab-case name
Click any entry to open it in the Editor panel on the right.
Filtering: The sidebar supports two audience filters:
- AI: Shows structured entries (bugs, patterns, decisions, gotchas)
- Human: Shows guide pages written for human readers
- All: Shows everything

2. Editor (Content Viewer)
When you click an entry in the sidebar, it opens in the editor panel. The editor renders:
- Markdown files (.md): Full rendering with headings, code blocks, tables, and syntax highlighting
- Mermaid diagrams (.mmd): Interactive visual rendering with zoom and pan controls
Mermaid Diagram Controls
When viewing a .mmd file, you get interactive controls:
- Scroll to zoom: Mouse wheel or trackpad pinch to zoom in/out
- Click and drag: Pan around the diagram
- Min zoom: The diagram never zooms out beyond its container — you always see the full picture
- Dark theme: Diagrams use Quack's brand colors with a dark background
3. Graph
The graph view shows your knowledge entries as an interactive node map. Each node represents a Brain entry, and nodes are color-coded by type:
| Color | Entry Type |
|---|---|
| Red | Bug fixes |
| Blue | Decisions |
| Orange | Gotchas |
| Cyan | Patterns / Diagrams |
| Green | Diary entries |
| Gray | Notes |
Click any node to open that entry in the editor.
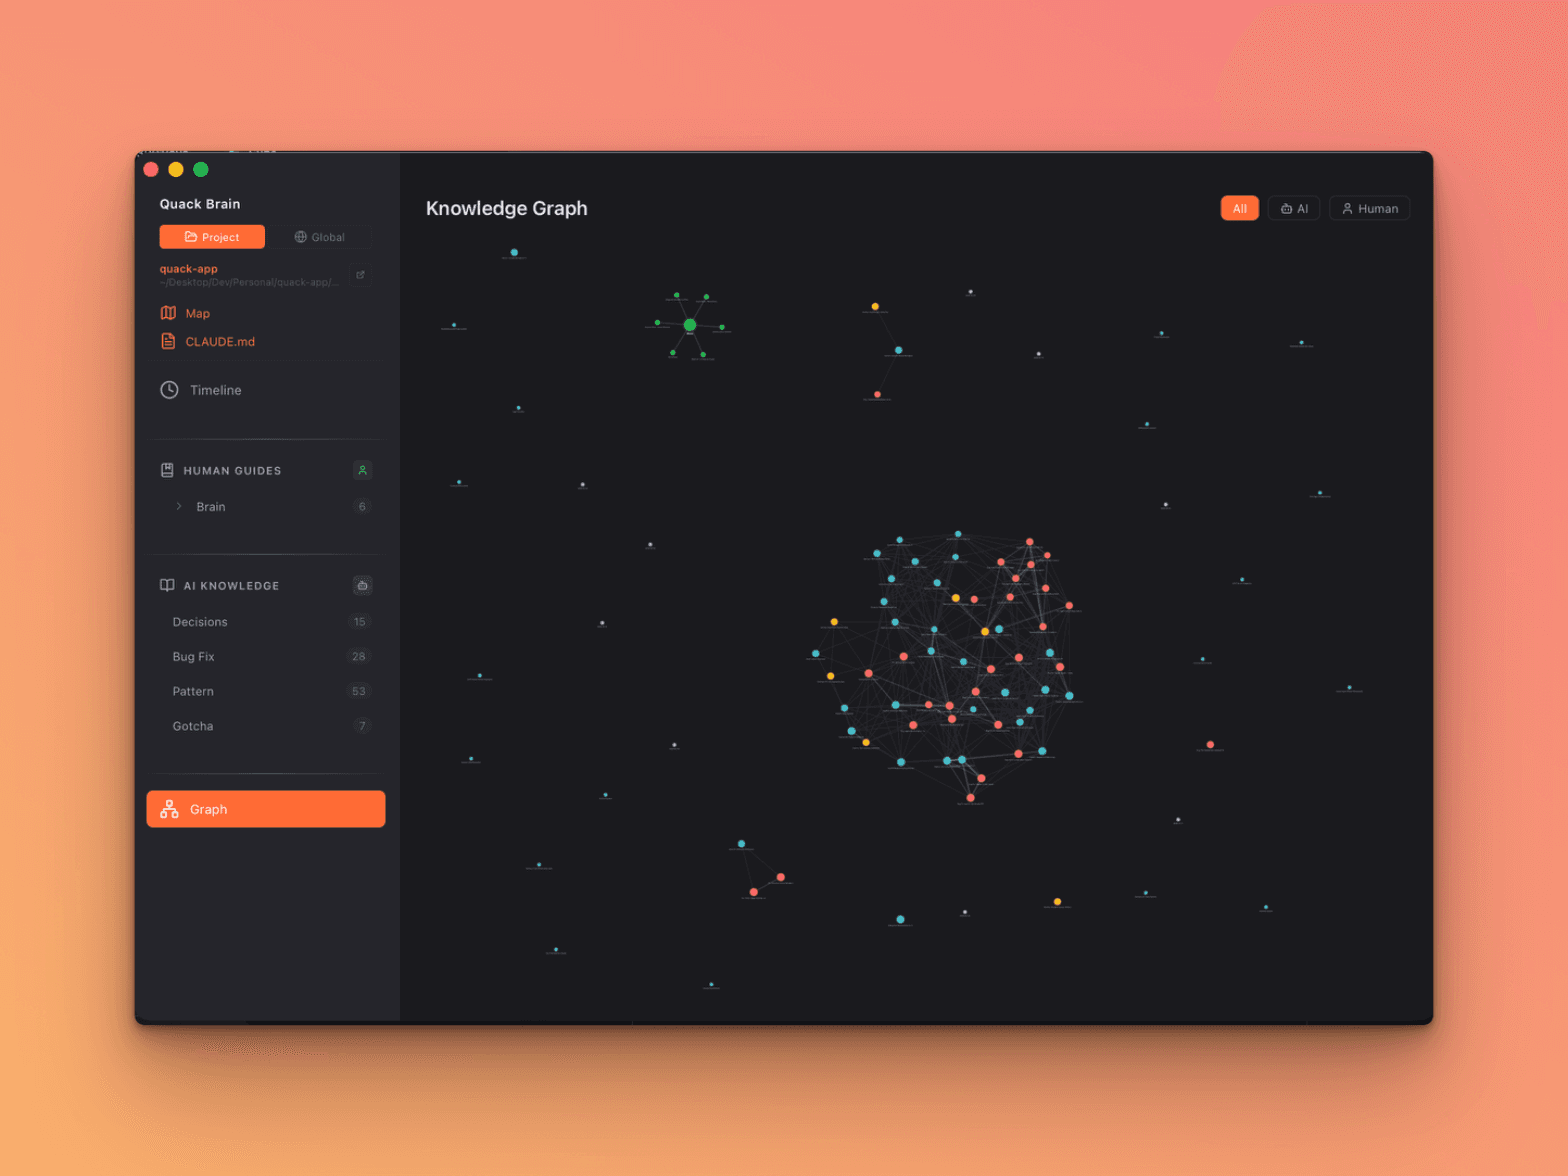
The graph helps you visualize the density and distribution of your knowledge — a project heavy on bug fixes might need better architecture, while one with many patterns is well-documented.
4. Timeline
The timeline shows a chronological activity feed of everything that's happened on your project. It pulls from three sources:
- Diary entries: Daily logs with time and author
- Brain entries: Bug fixes, decisions, patterns, gotchas (sorted by creation date)
- Activity logs: Agent actions (tasks, deploys, refactors)
For full timeline documentation, see Brain Timeline.
Navigating Between Views
The left sidebar has icons for each view. Clicking between them is instant — the Brain UI keeps your scroll position and selected entry when switching views.
Pro tip: Use the Timeline to spot recent activity, then click an event to jump directly to that entry in the Editor.
Keyboard-Friendly
The Brain UI supports standard navigation:
- Scroll: Browse entries in the sidebar
- Click: Open entry in editor
- Back/Forward: Navigate between previously viewed entries
What Shows Up in the Brain UI
The Brain UI reads from two sources:
| Source | What it shows |
|---|---|
{project}/documentation/ | Project-level knowledge: bugs, patterns, decisions, gotchas, diary, guides |
~/.quack/brain/ | Global knowledge (when "Global" toggle is on) |
Switch between Project and Global views using the toggle at the top of the sidebar.
Tips for Getting the Most from the Brain UI
- Write guides for complex features — they show up in the Human section with green badges, making them easy to find
- Add Mermaid diagrams to guides — visual architecture flows are immediately understandable
- Check the Timeline regularly — it's the fastest way to see what's been happening on your project
- Use the search in Timeline — type any keyword to filter across all entry contents
- Click diary events — they open the full diary file, showing the complete day's activity
Next: Brain Timeline — Activity feed with search, filters, and multi-user tracking
Previous: Second Brain — The knowledge store architecture